
Specialized Special New Series Insights
A few days ago, the PatSnap Innovation Research Center, a subsidiary of the technology innovation information service provider PatSnap, released the “2022 Specialized, Specialized, Special, and New “Little Giant” Enterprise Science and Technology Innovation Capability Report” (hereinafter referred to as the “Report”). The report sorts out the number, scale, financing and listing of 9,279 specialized, specialized, and new “little giants” companies announced in China since 2019. Jingtexin “little giant” enterprise conducted a panoramic scan analysis.
The report shows that the head effect of specializing, specializing, and new “little giants” enterprises in the three spatial hierarchy sequences of provinces, cities and counties has been continuously enlarged, and the degree of concentration has been continuously improved, and the agglomeration effect of technology enterprises is obvious; Jiangsu, Beijing, Shanghai and other provinces The “little giants” in districts and cities have outstanding scientific and technological innovation capabilities, and their average effective invention patents are nearly twice the national average.

The distribution and agglomeration effect of “little giant” enterprises is obvious
From the perspective of provincial units, the four batches of specialized and special new “little giant” enterprises are distributed in all 31 provinces, autonomous regions and municipalities, of which 20 provinces have more than 100 small giants. The top 10 provinces with the largest number of “little giants” are Zhejiang, Guangdong, Shandong, Jiangsu, Beijing, Shanghai, Anhui, Hubei, Hunan, and Henan.
From the perspective of prefecture-level units, the four batches of specialized and new “little giant” enterprises are distributed in 300 cities (prefecture-level cities, states, regions, and municipalities directly under the Central Government), of which 21 cities have more than 100 small giants. The top 10 cities with the largest number of “little giants” are Beijing, Shanghai, Shenzhen, Ningbo, Chongqing, Wuhan, Hangzhou, Chengdu, Tianjin, and Suzhou.
From the perspective of districts and counties, four batches of specialized and new “little giant” enterprises are distributed in 1,461 districts and counties, of which 4 districts and counties have more than 100 little giants. The top 10 districts and counties with the largest number of “little giants” are Beijing Haidian District, Shenzhen Baoan District, Shenzhen Nanshan District, Shanghai Pudong New District, Beijing Daxing District, Shanghai Jiading District, Shanghai Songjiang District, Shanghai Minhang District, Wuhan Jiangxia District, Wuhou District, Chengdu. Among them, Shanghai has 4 seats, and Beijing and Shenzhen each have 2 seats. Among them, Haidian District, Beijing, which ranks first, has as many as half of Shanghai’s “little giants”, surpassing Chongqing, Wuhan, Hangzhou, Chengdu and other prefecture-level cities. Area.
In general, the head effect of specializing, specializing and new “little giant” enterprises distributed in the three spatial hierarchical sequences of provinces, cities and counties continues to expand, the concentration continues to increase, and the agglomeration effect of technology enterprises is obvious. The top 10 provinces and cities account for 32.3% of all provinces and cities, and the proportion of the number of “little giants” (that is, the concentration rate of the province, CR10) reaches 68.1%; the top 10 cities account for 3.3% of the total number of cities. The proportion of the number of “little giants” (that is, the city’s concentration CR10) reached 33.3%; the top 10 districts and counties accounted for only 0.7% of all districts and counties, and the proportion of their “little giants” (that is, the concentration of the districts and counties CR10) ) reached 11.9%.
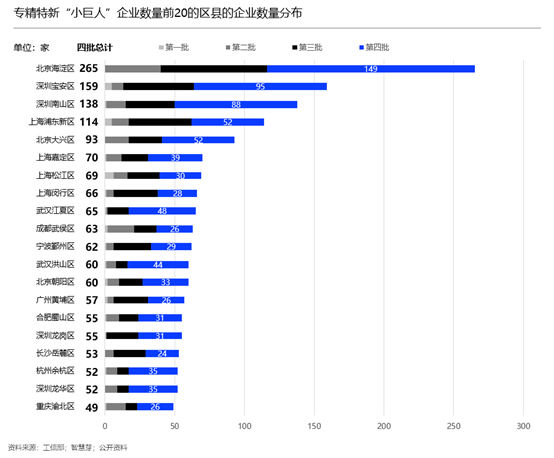
Figure: The distribution list of the number of enterprises in the top 20 districts and counties in the number of specialized, special and new “little giant” enterprises (source: Ministry of Industry and Information Technology, PatSnap, public information)

Jiangsu, Beijing and Shanghai “Little Giants” have outstanding scientific and technological innovation capabilities
The report further compares the number, scale, average business scale (calculated by the average number of employees) and average technology scale (calculated by the average number of effective invention patents) of specialized, special and new “little giant” enterprises in each province and city. “Businesses present different characteristics.
Specifically, the “little giants” in Beijing, Shanghai, Guangdong, and Ningxia generally show that their operating scale is smaller than the national average, while their technical scale is larger than the national average. Especially in Beijing and Shanghai, the average number of employees per company is only around 200, but the average number of effective invention patents is 24.08 and 23.22 per company, which are 46% and 52% higher than the national average.
At the same time, the “little giants” in Hainan, Jiangsu, Tianjin, Sichuan and Anhui generally showed that the scale of operation was larger than the national average, and the scale of technology was also higher than the national level. Especially in Hainan Province and Jiangsu Province, the average number of employees in each enterprise is around 330, and the average number of effective invention patents reaches 24.67 and 23.56 per enterprise, which are 55% and 48% higher than the national average, and the same as that of Beijing and Shanghai. quite.
In addition, the ratio from the horizontal axis to the vertical axis is equivalent to the technology intensity (that is, the density of invention patents per capita), among which the technology intensity of the “little giants” in Beijing and Shanghai is particularly prominent, reaching twice the national level. The number of effective invention patents per 1,000 people in Beijing and Shanghai reached 124.7 per 1,000 and 112.21 per 1,000, and the national average was 62.99 per 1,000.
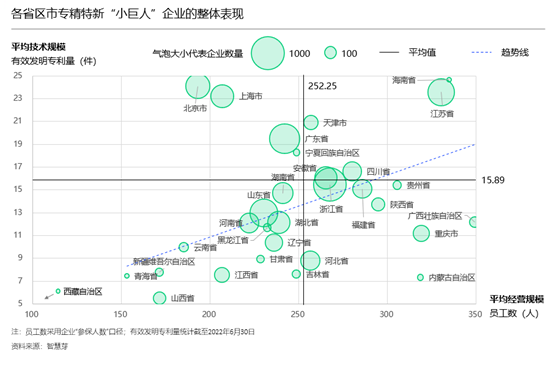
Figure: The overall performance of specialized, special and new “little giant” enterprises in various provinces and cities (Source: PatSnap)
Hot companies on Discovery
zoominfo-technologies xcome-technology ae-group-ag numeric-technologies
west-bengal-university-of-animal-and-fishery-sciences beijing-microelectronics
xinjiang-shihezi-zhongfa shenzhen-hdking rtsb-gmbh-rail-transport axion-ventures
undercover-colors wacoal-holdings kandelium-barium etrawler triginta-capital
shillong-assam-teer-today thyssenkrupp-uhde esperanto-technologies ningxia-ruitai-technology
minghui-pharmaceutical-shanghai-co-ltd zaihui