Innovation is a critical component of progress — whether developing a new product or tackling big-picture issues like the climate crisis. Making the best innovation choices, however, requires effectively measuring innovation.
In this article, we explore what leading and lagging indicators are and how to combine these data points to measure innovative output and make better decisions.
What are lagging indicators?
Lagging indicators, such as patents, measure past activity.
Although the insights from lagging indicators can be used to understand a company’s innovation and investment strategy, they don’t accurately depict real-time decisions. As such, these data points alone are unlikely to paint a complete picture of where a company, technology area, or sector is headed.
Plus, patent data can be misleading. A company may apply for patent for several reasons, such building out a defensive legal strategy or to reward creativity, not necessarily because it plans to develop products in that area. It’s also common for companies to patent several ideas early in the innovation process, and then later decide which of them to develop. For example, in 2016 Amazon patented an airship warehouse for drones, but it’s still just an idea.
What are leading indicators?
Leading indicators are data points that can predict the future direction of a company, technology area, or market. Examples include business and technology news, research papers, VC investment activity, and mergers and acquisitions.
Taken on their own, leading indicators are difficult to index and standardize. Unlike patents, there isn’t one universal categorization system to classify and group topics or categories of non-patent information. As an example, there are different journalistic and peer review standards. This can be a challenge when you are absorbing large amounts of information.
Also, public data is not extensive for these data types as for patents. For instance, while patents must be publicly disclosed, there is no obligation to share startup data. A company may also claim to be developing a product or conducting research that is not entirely true, but the claim was disclosed or amplified for PR purposes. As a result, there is a speculative element to these leading indicators.
Combining Leading and Lagging Indicators with Connected Innovation Intelligence
To paint a holistic picture of what’s happening in a technology area, market, or within a company, leading and lagging indicators can be analyzed alongside each other. Together, these insights offer more informed innovation measurement.
However, innate challenges still exist. Patent data can be difficult to search and does not always reflect the correct owner of patents, while non-patent data can be challenging to aggregate and index. To overcome these hurdles, many professionals are turning to Connected Innovation Intelligence (CII) platforms such as PatSnap. Powered by artificial intelligence (AI) and machine learning, CII platforms comb through and connect billions of global data points (both leading and lagging) and connect them in a way that makes sense.
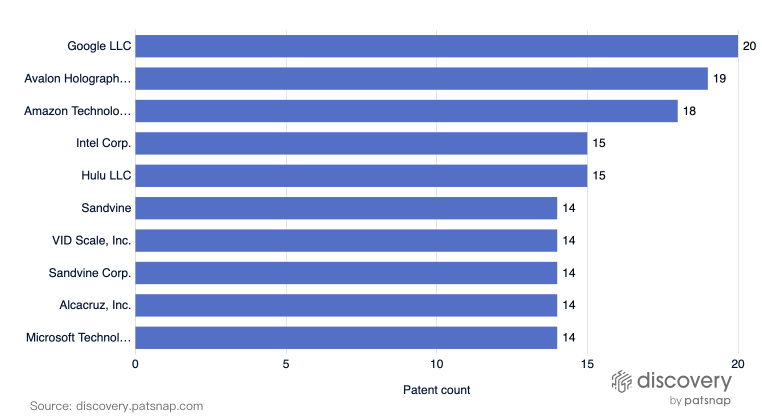
For example, to understand the most innovative companies in video streaming, you can run a patent filing search, and uncover the following players:

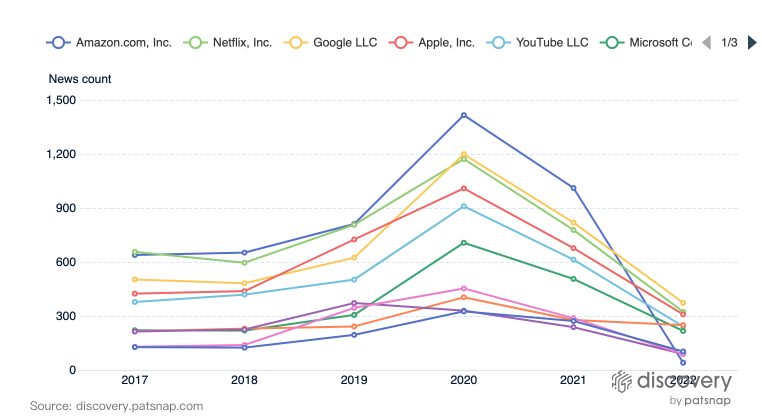
Drilling further, an analysis of technology news reveals the following list:

Looking at both the lagging indicators in the first chart with the leading indicators in the second chart, Amazon and Google appear in the top three of both charts and may have strong cases for being top innovators in the space. Just as importantly, the two data sets raise intriguing questions about new players and the strategies of existing players.
These insights (which represent a minute fraction of what you can uncover with CII) can be drilled down further and analyzed to extract relevant information, uncover key market happenings, and inform strategic business decisions. To learn more about CII and how it can help your organization accelerate innovation, click here to download our #1 bestselling Amazon eBook.
Recommended by companies
Apple Dynamic Network Services Oracle America Sensormatic Electronics Ikeda Bussan Huawei Technologies ZTE Mitsubishi Electric Engineering Samsung Electronics QUALCOMM Freddie Mac Federal National Mtge Siemens UnitedHealth Group General Electric Co AES Marriott International Shell Welltower HCA Healthcare Westconnex Meituan Thermo Fisher Scientific Sea Cruise Air Canada Lineage Logistics Lucid Motors National Treasury Mgmt Universal Music Group Microsoft Disney Baidu Google Oracle IBM BYD Tesla PatSnap Oppo Xiaomi DJI Facebook Spotify Netflix
